Note /
What positional uncertainty in a mangrove canopy boundary means
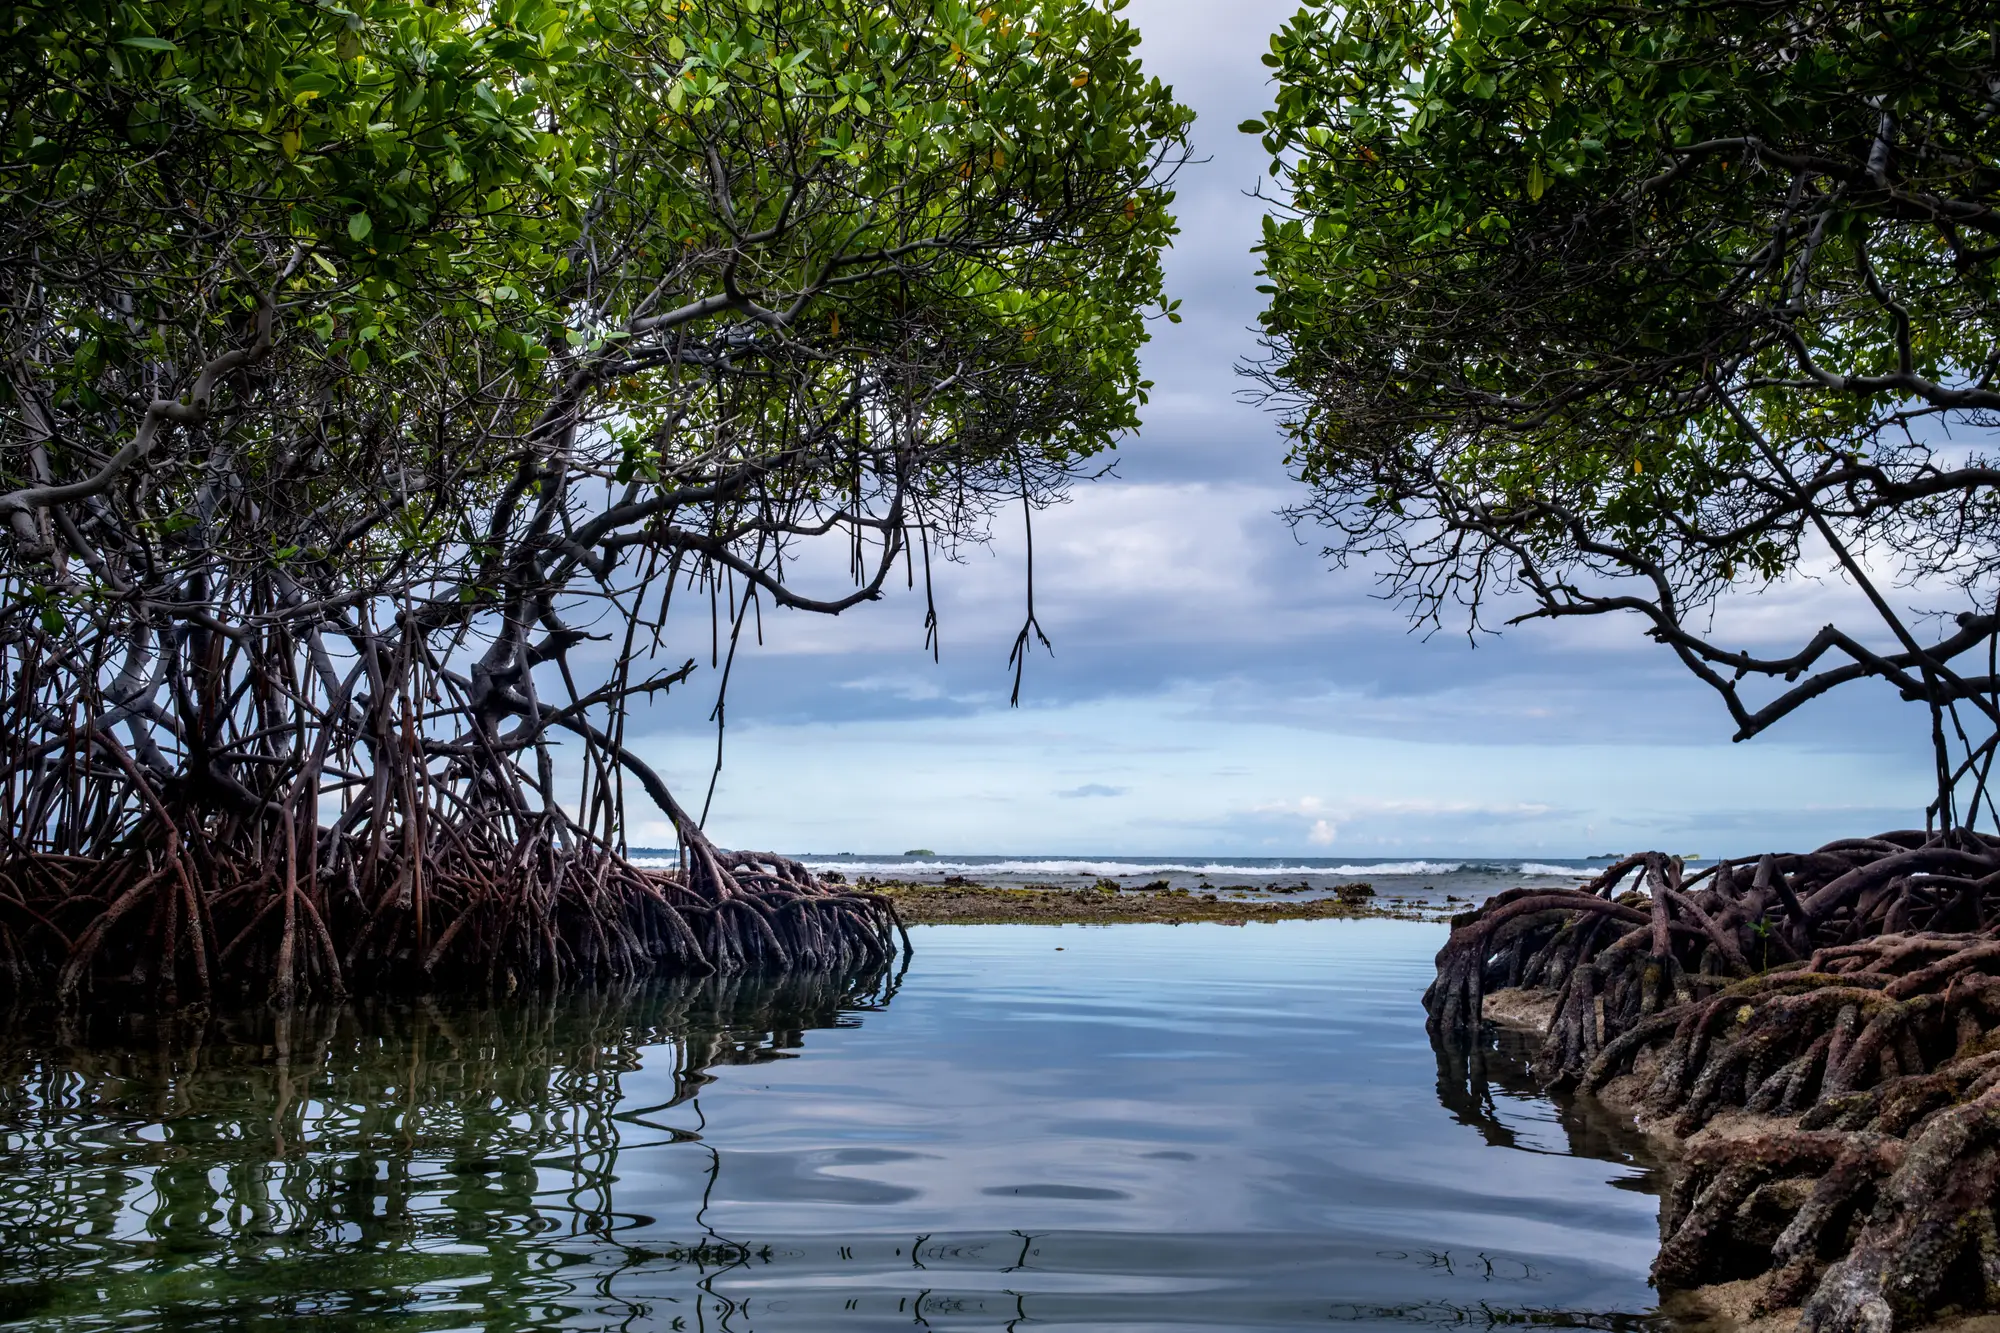
A verifier reads your monitoring report, gets to the extent map, and asks: what's the positional uncertainty on this boundary? If you've only ever drawn the line and moved on, that question lands hard. Here's what it's asking, and what to do with it.
Positional uncertainty is the gap between where you've drawn the canopy edge on a map and where that edge sits on the ground, measured in meters, and traced to a specific source: pixel size, imagery date, scene-to-scene drift, or the hand that drew the line.
Where the error comes from
A few sources stack on top of each other every time someone draws a boundary:
- Pixel size. At 10 m resolution, a half-pixel of positional error is 5 m before anyone's even made a judgment call. At 0.5–2 m, that floor drops a lot, but it never hits zero.
- The fringe itself. Sparse, stunted, or storm-damaged mangrove at the seaward or landward edge doesn't give you a clean spectral break from mudflat or water. The canopy thins out gradually, and the "edge" is really a gradient someone has to decide to call a line.
- Scene-to-scene georeferencing. If this year's image and last year's came from different sensors, or were processed by different providers, the underlying pixel grids may not sit exactly on top of each other, even before anyone digitises anything.
- The digitiser. Hand the same cloud-free scene to two analysts, or to the same analyst a month apart, and you'll get two slightly different lines, because each one is making the same judgment call at 1:5,000 zoom, repeatedly, across a 40-hectare project boundary.
That last one is worth naming on its own, because it behaves differently from the pixel-level sources above.
Digitising uncertainty vs sensor uncertainty
Sensor-driven uncertainty is fixed by the imagery you bought: ground sample distance, geolocation accuracy, the date and angle of capture. You can state it in your report and move on.
Digitising uncertainty is driven by the method, and it's the one a registry reviewer will probe, because it's the one a project can control. If two passes at the same scene by the same analyst produce boundaries that differ by 15 m along the fringe, that's your digitising uncertainty, and it's a number you can report. If the boundary was drawn by eye against whatever cloud-free scene happened to be available that year, with no record of the method, a verifier has no way to separate mangrove that genuinely moved from a line that was simply drawn differently this time. That ambiguity is exactly what shows up as a false loss or gain signal between reporting years, and it's exactly what gets flagged in review.
Why a registry asks about it
Under VM0033 and comparable methodologies, your area estimate feeds directly into the carbon stock calculation. A boundary that's uncertain by a few meters along a long, convoluted mangrove fringe can translate into a meaningful swing in hectares, and that swing carries straight through to the credits a project can claim. Registries ask about positional uncertainty because they need to know how much of your reported area change is real ecological signal and how much is noise from how the line was drawn. A project that can state its source imagery, its ground sample distance, its capture date, and whether the method was consistent year over year is answering the question before it's fully asked.
That's the part worth putting in the report explicitly: the sensor, the resolution, the date, and whether this year's boundary was produced the same way as last year's. Consistency of method, scene to scene, does more to shrink reported uncertainty than almost anything else, because it removes the digitiser as a variable.
If your extent layer has been redrawn from a different provider's scene every reporting cycle, with no fixed method behind it, that's the uncertainty a verifier is reacting to. Mangrove Monitor builds an annual canopy boundary, loss, and regrowth layer from the same kind of high-resolution source each year, matched to your reporting cycle, so the line in this year's map and the line in last year's were drawn the same way. Have a look at what that annual extent layer includes.