Sheet 01 / Annual extent
Stop redrawing the mangrove edge by hand every reporting year.
An annual extent layer for your project area, with loss and regrowth polygons cut against last year's boundary. Each polygon carries the date of the scene it came from.
DrawingMangrove Monitor
- GSD
- 0.5–2 m
- Cadence
- Annual
- Platform
- High-res satellite
- Spectral
- Multispectral
High-resolution multispectral satellite imagery, 0.5–2 m GSD. One pass a year, timed to your reporting cycle.
Sheet 02 / The job today
Where hand-digitising runs out
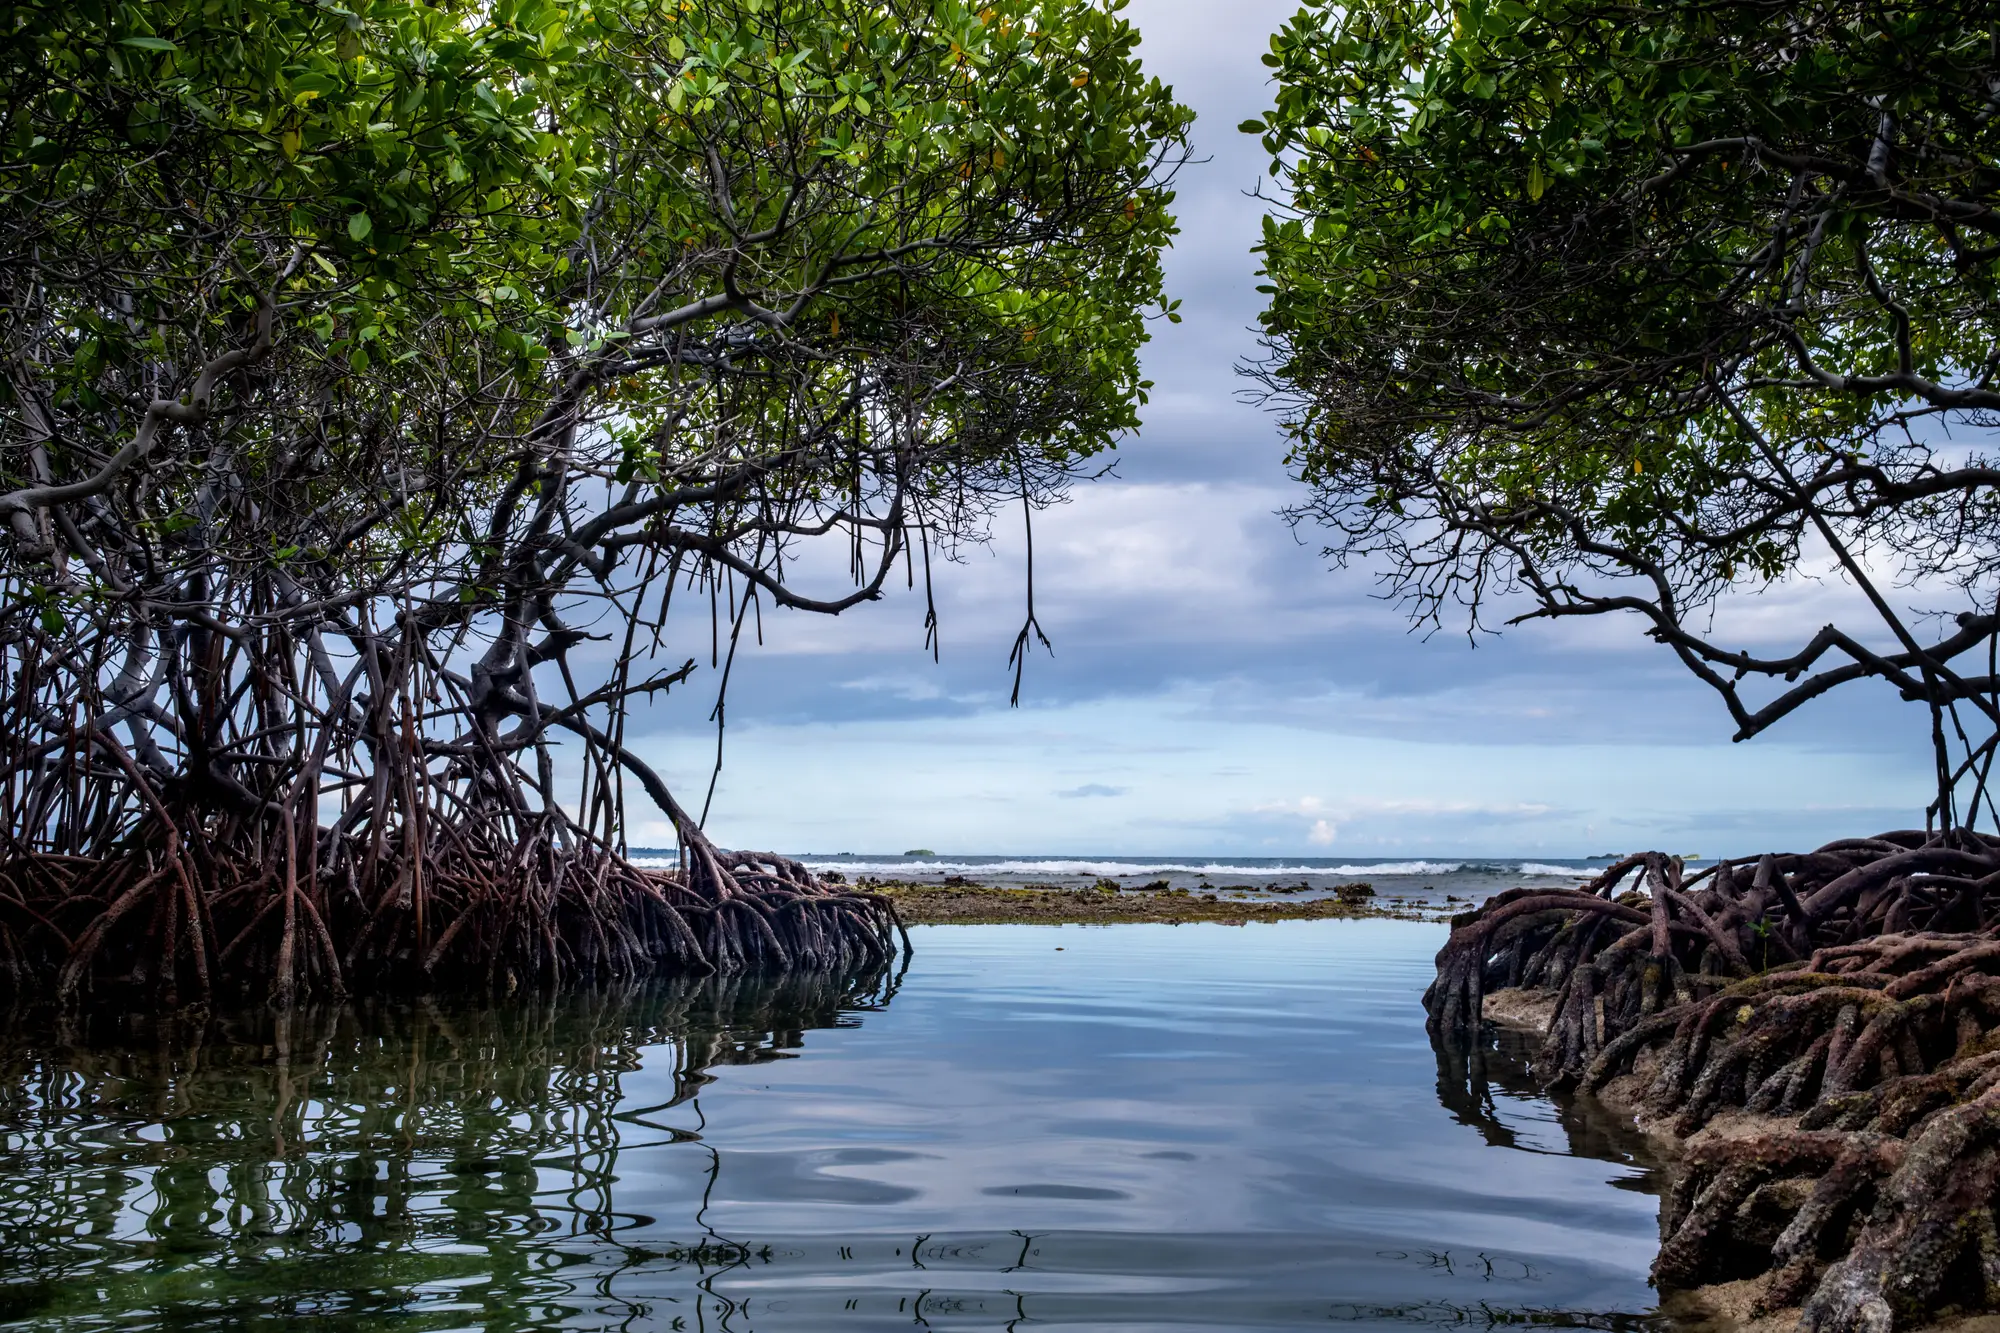
Somebody on your MRV team opens last year's polygon, finds whichever scene came back cloud-free, and traces the canopy edge again. The scene is rarely from the same month or sensor as the last one. Loss and regrowth get marked by eye along the tidal fringe, where the boundary moves most. Then the verification body asks why the line shifted, and you cannot always say whether the forest moved or the scene did.
Schedule AThe extent section, step by step
| Step | Hand-digitised | With Mangrove Monitor |
|---|---|---|
| 01Choosing the scene | You take whichever scene came back cloud-free that year, and it may differ in season and sensor from the last one. | The pass is picked from the clearest window in the season, matched to your reporting cycle, and the scene date is printed on the layer. |
| 02Drawing the canopy edge | An analyst traces the boundary by hand against the imagery, and two people would draw it slightly differently. | The canopy boundary is segmented from the multispectral bands the same way each year, then cut to your project boundary. |
| 03Loss and regrowth | Loss and gain are marked by eye against last year's line, and the tidal fringe is where the arguments start. | The new boundary is compared with the prior year's, and the difference comes back as separate loss and regrowth polygons. |
| 04Showing where it came from | The method lives in a note or in the analyst's head, and the scene sometimes gets lost between reports. | Every polygon carries its scene date and source, so the layer can go to the verification body with its provenance attached. |
| 05The monitoring report annex | Polygons are exported and reformatted by hand for the annex, every year. | An export laid out for a report annex comes with the layer, and a short summary note says what moved since the last pass. |
| 05.1Still yours | The fieldwork. Plots, survival counts, soil carbon and species surveys stay with your team, and the registry methodology still governs the claim. | |
Sheet 03 / Register
What comes back each year
Extent and change layer
The canopy boundary for the year, with loss and regrowth polygons against the prior year's boundary, cut to your project area. Delivered once per reporting year. It replaces the hand-drawn trace in the ledger above.
Annual summary note
A plain-language read of what moved since the last pass, with the scene date and any gaps stated. Written so it can be read alongside the extent section of your report.
Report-ready export
Area by class laid out for a monitoring report annex, with a vector copy of the polygons. This is the annex step in the ledger.
Sheet 04 / Reporting cycle
How it works
- Reporting year set
Send the project area
Your project boundary or concession as a shapefile, GeoPackage or GeoJSON, plus the reporting year and the format your registry expects.
- Before the pass
Agree the window
Before the pass, we look at the season around your reporting date and tell you which window is likely to give a usable scene. In a heavily overcast zone that may be a wider window than you had in mind.
- The pass
Map the year
The chosen scene is cloud-screened and the canopy is segmented. It is then compared with the prior year's boundary, so loss and regrowth come out as their own polygons.
- Report drafting
Delivery
The dated layer, the summary note and the annex export, timed to your reporting cycle. Next year the same steps run again against this year's boundary.
Sheet 05 / General notes
Limits
These are the places where the older method still holds up, or where the layer stops short.
Canopy, not species
The layer separates mangrove canopy from everything else. It does not tell species apart. That takes finer spectral data or a field crew.
Cloud sets the window
Tropical coasts are overcast for much of the year. The pass comes from the clearest available window, and a persistently cloudy site may need a wider one, agreed per site.
0.5–2 m is the floor
A plantation of young seedlings, or a propagule line, is too small to resolve. Canopy that has closed up does show. Thin fringes only a pixel or two wide will be uncertain.
One pass a year
This is an annual layer matched to a reporting cycle. It will not catch a clearing that happened and regrew between two passes, and it is not a live feed.
Extent, not carbon
The layer shows where canopy is and how it changed. It does not measure biomass or soil carbon, and it does not verify or issue credits.
Sheet 06 / Fit
Who it's for
Switch if you
- Run a blue carbon project and redraw the mangrove extent each reporting year for a monitoring report.
- Need loss and regrowth against a baseline, dated and sourced, for a verification body to read.
- Want the same method applied year after year so a change in the line means a change on the ground.
Stay with hand-digitising if you
- Have a single small site where an analyst already traces it in an afternoon and nobody questions the line.
- Need species-level or plot-level detail, which needs field work or finer data.
- Want continuous or near-real-time alerts. This is an annual pass.
Sheet 07 / Queries
Questions from project teams
Q01Does this replace our hand-digitised maps?
For the annual extent trace, yes, or it can sit beside your own trace as a cross-check. The field plots and everything else in your monitoring plan stay as they are.
Q02Does it certify carbon credits?
No. It is an extent and change layer. Your registry methodology and verification body still decide what can be claimed.
Q03How do we check it against our own ground truth?
Give us the plots, GPS tracks or photo points you already hold. Each polygon carries its scene date, so you can compare it with what your crew recorded in the same season.
Q04What if our site is cloudy all year?
The pass uses the clearest window in the season. A site with heavy cover may need a wider capture window, which we work out with you before the pass.
Q05Can it tell species apart?
No. It separates mangrove canopy from non-mangrove. Species need finer spectral data or a field survey.
Q06Will you quote an accuracy figure?
No. Spectral mix and cloud differ by region, so we do not quote one figure for everywhere. Bring your ground-truth points and we compare them with the layer for your site.
Q07What format does it arrive in, and does it open in our GIS?
A GeoTIFF and vector polygons, plus a CSV area table. They open in QGIS or ArcGIS.
Q08Who owns the layers, and what about the imagery?
Ownership and use terms for the delivered layers are written into the contract before work starts. The imagery providers keep their own licences on the source scenes.
Q09How is it priced?
Each project is scoped on its own. You get a written scope to take through your own approval.
Sheet 08 / Issue
Send the project boundary and the reporting year.
We will tell you which window suits your site and what the layer will cover.