Note /
Mapping the mangrove edge in turbid estuarine water
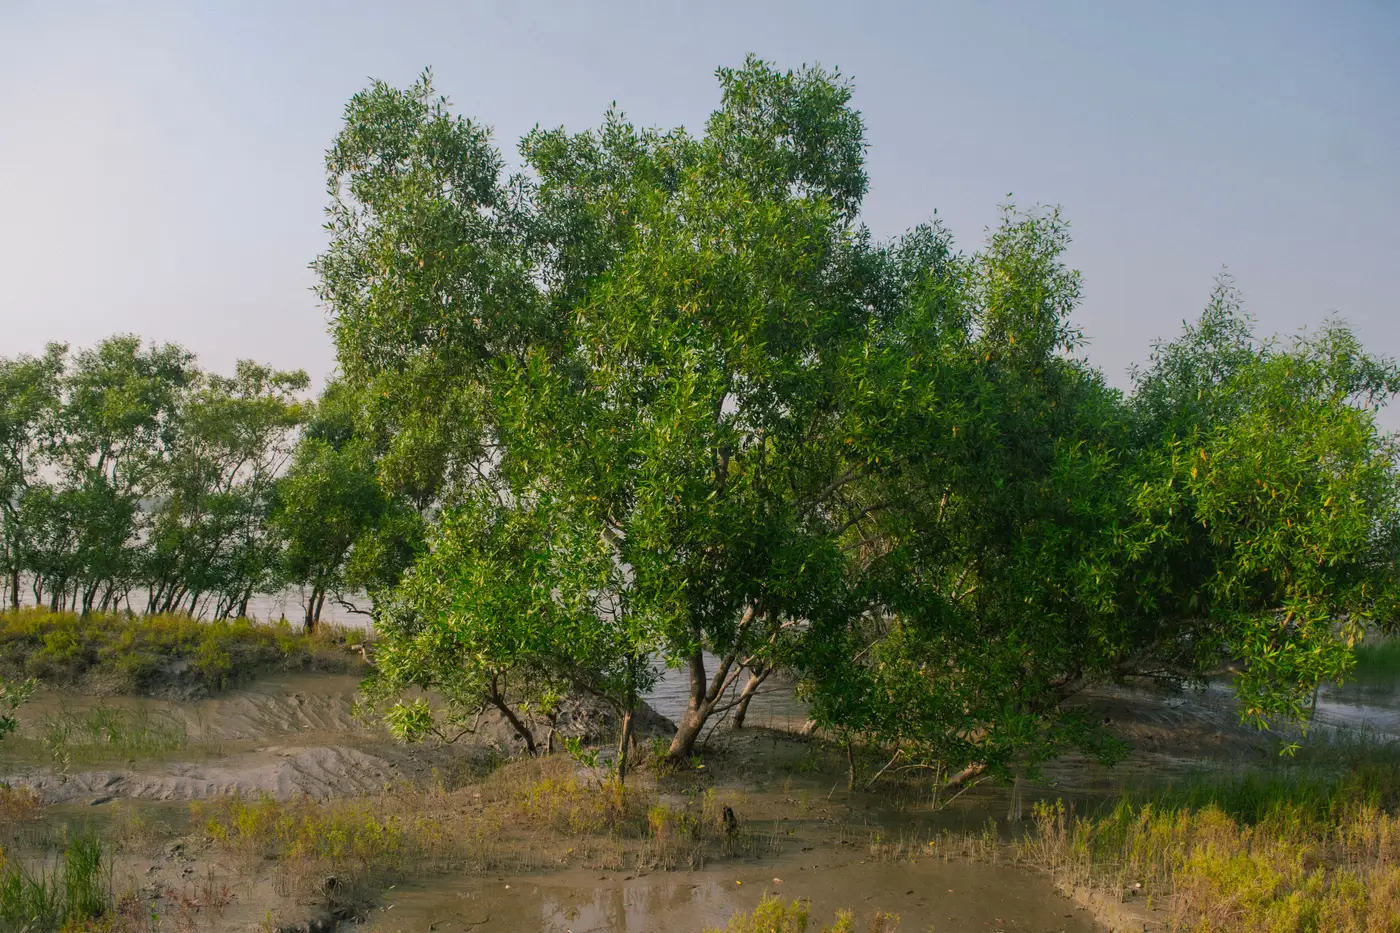
Anyone who has tried to trace a boundary off a scene shot at low tide on a silty delta knows the problem isn't finding the trees. It's telling the canopy edge apart from a mudflat that, for about twenty minutes a year, reflects almost the same color.
Suspended sediment does strange things to a standard vegetation index. Turbid water scatters more red and near-infrared light back to the sensor than clear water does, which pushes its NDVI value up toward the low end of what young mangrove regrowth or a sparse fringe stand produces. Run an automated threshold over that scene and the classifier will happily draw your boundary ten or fifteen meters inland of where the trees actually stop, or it'll punch holes in a thin fringe because a few turbid pixels scored high enough to pass as water. Either way, the polygon you hand to a verifier doesn't match what a field team would walk out and find.
Why a vegetation index alone gets fooled here
NDVI was built on the assumption that water is dark and vegetation is bright in the near-infrared. That holds in clear water. It stops holding once sediment load gets high enough to brighten the water signal, which is most tidal creeks and deltas on any given day, and especially right after a spring tide stirs the bottom. The near-infrared band that's supposed to separate canopy from everything else is exactly the band that turbid water contaminates most.
Green and SWIR bands behave differently. Water, turbid or not, keeps absorbing shortwave infrared strongly, while canopy, even sparse canopy, keeps reflecting it. A green/SWIR or NIR/SWIR ratio (something closer to a wetness index than a greenness index) holds up where NDVI alone falls apart, because it's not relying on a brightness assumption that turbidity breaks. Most project teams we've talked to run NDVI as a first pass and a SWIR-based index as the gatekeeper on the edge pixels, specifically in the tidal flat zone where the two signals disagree.
Tide stage matters as much as band choice. A scene at mid-ebb exposes a strip of bare, wet mud at exactly the elevation where the fringe mangroves sit, and wet mud at that moisture level can sit closer to canopy spectrally than dry mud does. Pulling the acquisition metadata and checking predicted tide height for the scene time, before you commit to that image as your annual baseline, catches a surprising number of boundary errors before they ever reach the classifier.
Drawing the boundary so a verifier can check it
Once the index is right, the boundary line itself needs a rule a reviewer can follow back to the pixels, not a hand-smoothed curve. A documented threshold, a buffer rule for isolated flagged pixels, and a note on which band combination and tide window the delineation came from, turns the boundary into something a registry auditor can retrace rather than something they have to take on faith. That paper trail tends to matter more at submission time than the extra half-percent of classifier accuracy teams chase instead.
It also helps to pick one clean, low-turbidity, low-cloud window each reporting year and stick with it rather than taking whatever scene happens to be available in month twelve. A boundary redrawn from a different tide stage and a different sediment load every year will show loss and regrowth that's really just noise in the water column, not anything that happened to the trees.
This is the exact problem Mangrove Monitor is built around: a dated, sourced extent layer pulled from a fixed point in the project's reporting cycle, with the canopy boundary, loss, and regrowth polygons delivered as GeoTIFF and vector so they sit next to the monitoring report instead of replacing it with guesswork. If this year's extent map is due and the only cloud-free scene on hand is sitting in turbid water, it's worth a look at how that layer gets built.